





Let's look at one conversation. The agent verified the customer, showed empathy, followed the process, read the disclosure and closed correctly. Every checkpoint passed and the call scored 96% in QA.
But the customer gave it a 2 out of 5 for CSAT. Replay the sentiment and you can see where it turned: at about the four-minute mark, when the agent asked a question the customer had already answered.
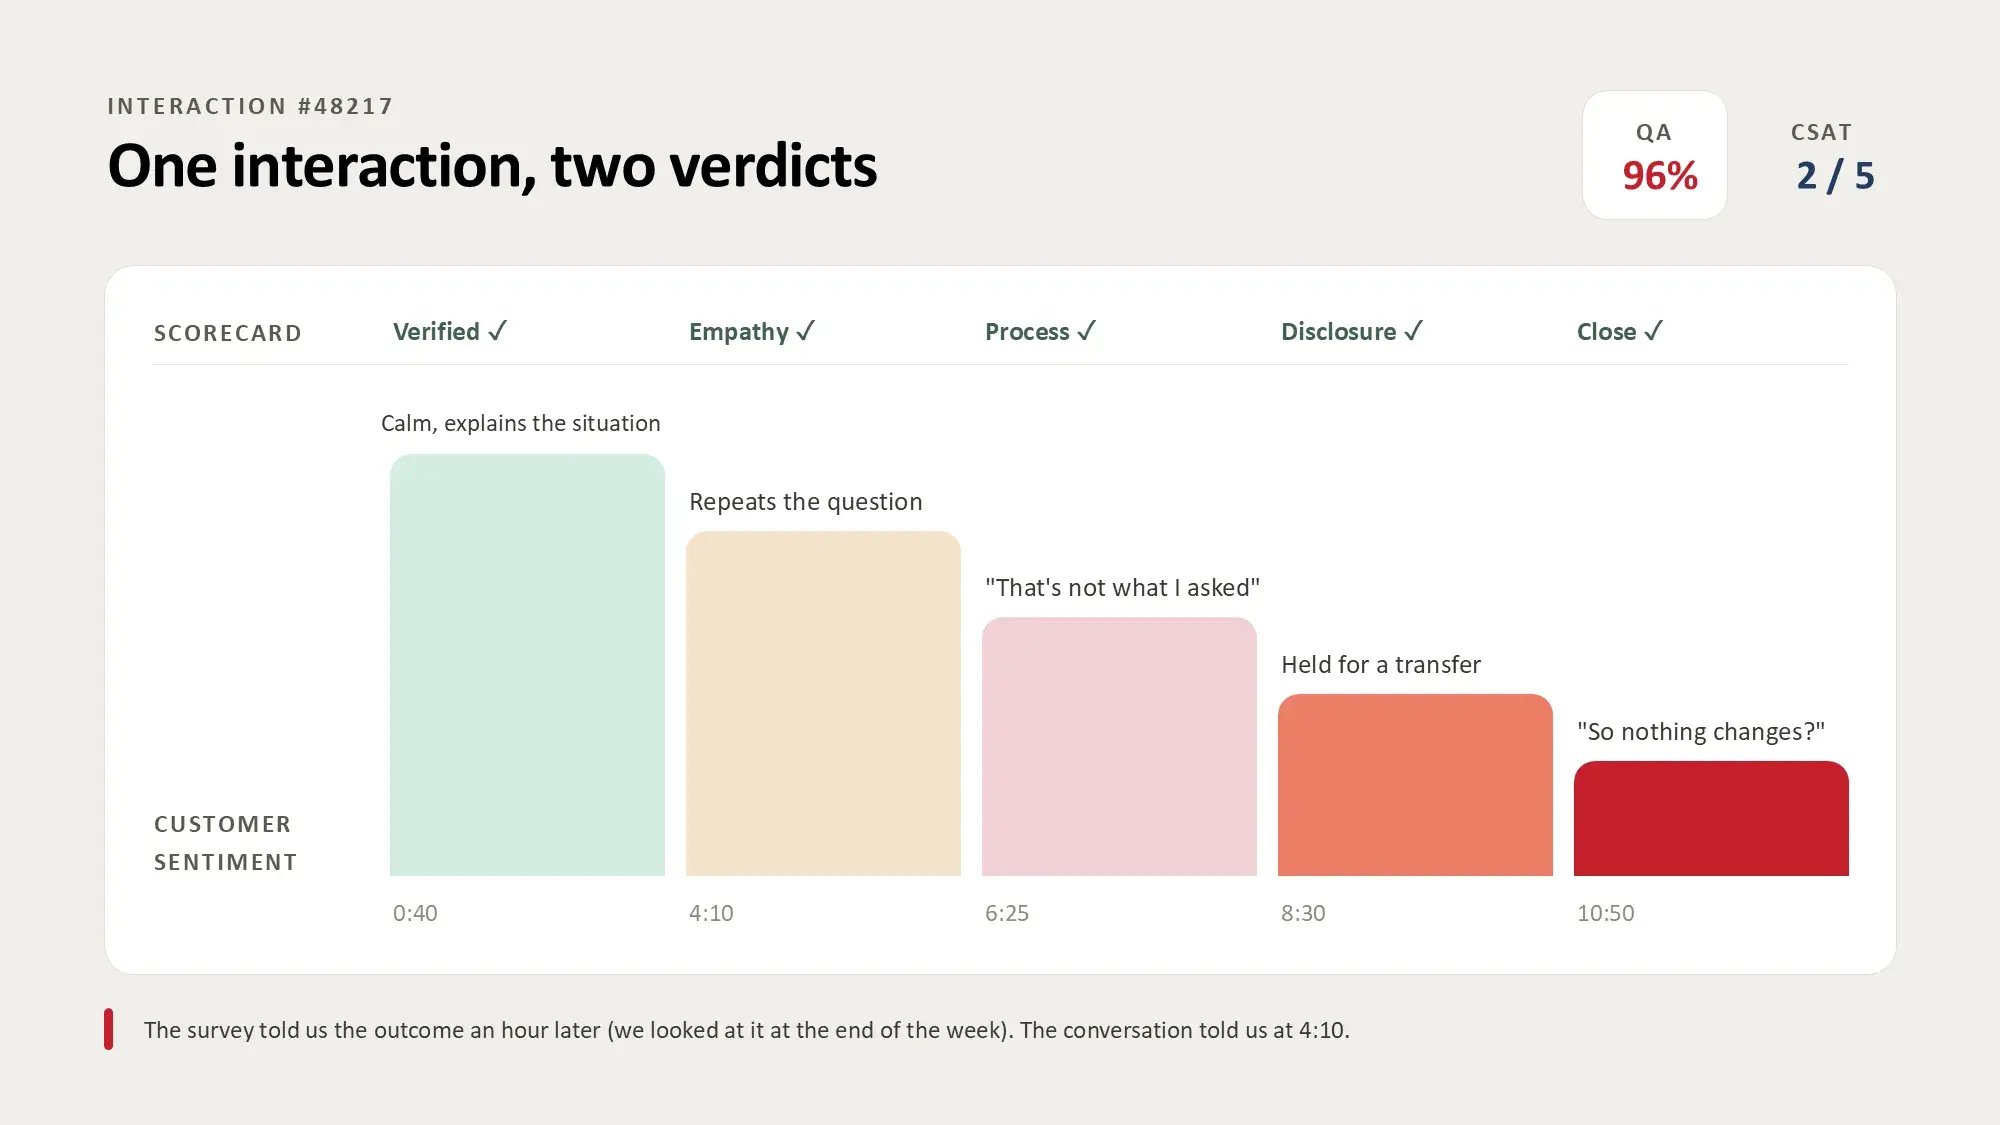
That's the QA scores vs CSAT problem in a single call, and you probably see it at scale too. A QA average climbs month over month while the CSAT figure next to it won't budge. Two teams, two reports, and, in isolation, both numbers are right. Look at them together, though, and they don't match up.
At our recent CX Excellence Masterclass on the link between QA and customer experience, we asked attendees whether they present QA and CSAT as separate metrics to leadership. Everyone who answered said yes, always separate. And that matches what we hear from customers on a regular basis.
Unless you've set things up a certain way, QA and CSAT mostly measure different conversations, and a large share of a typical scorecard's weight sits on things the customer never sees. Averaging the customer's view into the agent's score only hides the gap. The fix is to score the conversations you survey and keep the customer's view (how they felt, and whether they got what they came for) as its own number.
Why QA and CSAT were never going to agree
They're mostly measuring different conversations
Let's think about coverage first. The generally accepted industry ranges put CSAT response rates somewhere between 5% and 10% of contacts, and manual QA at 2% to 5% of conversations. Pick the two samples independently and, by our own rough arithmetic, only about one scored conversation in every 10 to 20 has a survey attached. So most of the time you're comparing an average of some conversations with an average of totally different ones.
Of course, some teams do route surveyed contacts into QA. The thing is, they usually route the unhappy ones. That's a sensible way to find out what went wrong on a bad call, but it skews the comparison, because the scored set is now weighted toward failure.
Aaron Mulville, who led the CX Masterclass, put the sample problem in simple terms: "Decisions need a population, not a sample… a 3% sample size is an anecdote."
Much of your scorecard measures things the customer never sees
A big reason QA and CSAT tend to diverge comes down to the questions on your scorecard, and the fact that a lot of them don't focus on what the customer experiences. Some questions do track what the customer lives through, yes:
- Was I understood the first time?
- Did I have to repeat myself?
- Was I put on hold without being told why?
- Did I have to get in touch again about the same thing?
But others track things the customer has no way of knowing about: the exact wording of a regulatory disclosure, notes and dispositioning, CRM hygiene, whether each internal system step was followed. As Aaron said in the session, "Don't get me wrong, these are all things that you absolutely should be measuring." None of them can move a satisfaction score, though, because the customer never sees them happen.
COPC's work on aligning QA and CSAT makes a related point: assessors often pass a transaction where the agent did everything right but policy stopped them from resolving the issue, and the customer would call that same transaction a failure. Gartner's guidance on modernizing customer service quality assurance points the same way, shifting QA's focus from individual rep performance toward capturing voice-of-the-customer and CX data.
So neither team is doing anything wrong. QA is doing the job it was designed for, and CSAT is reporting on something else, mostly from different calls.
Want to compare the two on the same conversations? The masterclass recording shows how to set up one scorecard so QA and the customer's view can finally sit side by side. Get the masterclass recording, plus the post-session pack and a regression workbook you can run on your own data.
How one overall score can hide the customer's experience
COPC published an example that makes the averaging problem hard to argue with. A contact center was reporting an 86% overall quality score to management. Split into three measures, it read very differently: 60% of transactions were free of errors that affected the customer, 70% were free of business-critical errors, and 100% were free of compliance errors.
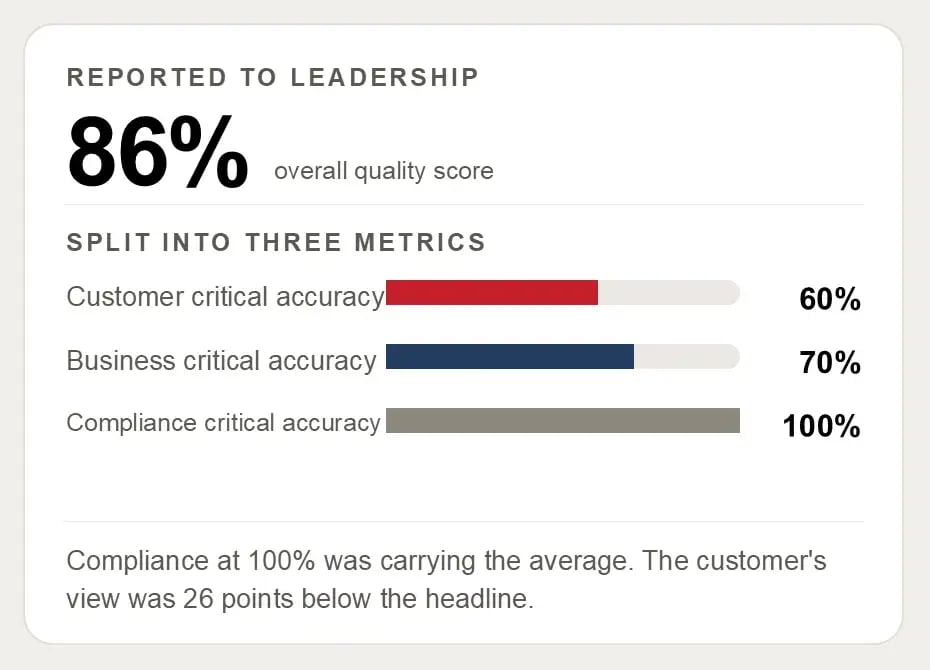
The perfect compliance figure was holding the average up. By our subtraction, the customer's view sat 26 points below the number leadership saw.
COPC's own fix is to report the three measures separately. The same logic applies to the fix most often suggested for QA and CSAT drift, which is to add sentiment and resolution into the agent's score. Do that and you've rebuilt the 86%: one tidy number with the customer's experience diluted inside it. Keep the customer's view separate and it stays where leadership can see it.
Where to start closing the gap
Work out your invisible weight
You can do this tonight with your scorecard and a calculator. Go through every question and sort it into two columns: the customer feels this, or the customer never knows. Add up the weight in the second column.
That total is your invisible weight: the share of your scorecard's weight that sits on things the customer can't perceive. It's also the ceiling on how far your QA score could ever track satisfaction. If 40% of the weight is invisible, QA improvements on those questions may not be reflected in CSAT.
Which of the remaining questions actually move satisfaction is harder to work out on a calculator. That's what the regression workbook from the masterclass is for, run on your own scorecard and your own survey results.
Score the conversations you survey
The coverage problem shrinks once the conversations you survey are also the ones you score. With manual review at 2% to 5% coverage, that's rarely realistic. AI scoring changes the arithmetic. One high-volume support operation we work with had been reviewing three or four chats a month; with AI Auto Scoring it now scores nearly 4,000, taking coverage from about 0.1% to 100%.
Keep people on the judgment cases, such as regulatory questions, high-risk calls and disputed scores. How you split that work is its own decision, and there's a guide to how often a human should review AI scores if you're setting the rules now.
Keep the customer's view as its own number
Once you're scoring the surveyed conversations, resist the urge to average the two. Keep the agent's score and the customer's view side by side, and a new measure falls out of the comparison: mismatch rate, the share of interactions that pass QA but fail the customer's view. The session shows how to get yours.
This is where conversation analytics and business intelligence do their work. The first surfaces the topics and sentiment in each scored conversation after it ends; the second puts quality and customer sentiment in the same report.
Bring the CSAT owner in from the start
A page comparing QA and CSAT that lands on leadership's desk without the CSAT owner's input reads as a challenge to their numbers. Bring them in before the first report goes up. They own the survey and know where it's weak. And the gap is as much their problem as yours.
Get the full method from the masterclass
The gap between your QA scores and CSAT is information. Most teams average it away, then spend the next quarter explaining a number that was never going to move.
Want the full method for closing it? Get the CX Excellence Masterclass recording and the form sends you three things:
- The recording, including the scorecard setup the session calls a hybrid scorecard, where the customer's view is kept apart from the agent's score
- The post-session pack, with that scorecard's structure, a four-signal weekly check for spotting a CSAT drop weeks before it lands, and how to get your mismatch rate (how often a call passes QA but fails the customer)
- The regression workbook, for finding which of your QA questions actually move satisfaction.